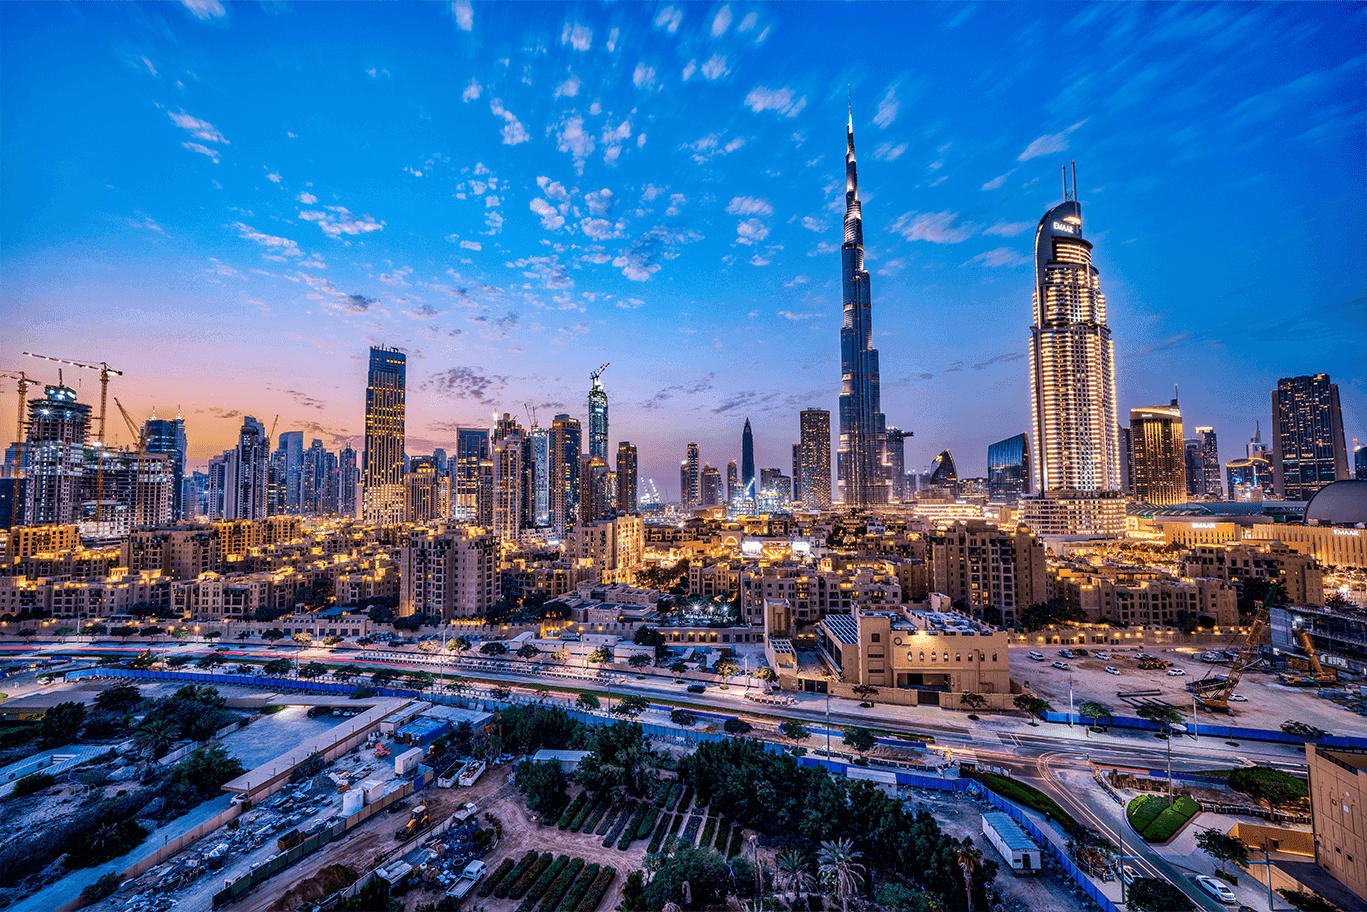
Dubai property market summary
The Dubai residential market is cooling gently rather than falling. As of 15 July 2026, 5,138 residential transactions were registered this month, 69.9 percent of them off-plan. Across the 91 communities tracked, the median price fell in 59 and rose in 31.
| Metric | Value |
|---|---|
| Transactions registered (month to date) | 5,138 |
| Off-plan share (Oqood) | 69.9% |
| Ready/resale share (title deed) | 30.1% |
| Communities tracked | 91 |
| Communities down month-on-month | 59 of 91 |
| Median of community medians | AED 3,131,835 |
| Lowest entry point | International City, AED 424,987 |
| Rental contracts registered | 28,547 |
| Average apartment rent (annual) | AED 72,949 |
The clearest finding this month is a pattern: prime and waterfront communities posted the largest declines, while mid-market and villa communities posted the largest gains.
What share of Dubai property transactions is off-plan?
Off-plan accounted for 69.9 percent of Dubai residential transactions this period. Of 5,138 registered deals, 3,590 were recorded through Oqood, the off-plan registration system, and 1,548 were title deed transfers of completed property.
About seven in ten buyers are purchasing a home that has not been built. The economics explain it: off-plan typically opens at a 10 to 20 percent down payment with the balance staged across construction, while a completed unit generally requires payment in full or mortgage finance at the point of sale.
The trade-off is income. With an average apartment rent of AED 72,949 a year, a completed property generates cash flow from the first month, while an off-plan unit produces nothing until handover. The choice is between a cheaper entry and an earlier income.
Median property price in every Dubai community (full table)
The table below gives the median transaction price for all 91 tracked communities, from lowest to highest. Median means the midpoint of recorded sales: half of deals in that community closed above the figure and half below.
| Community | Median price (AED) | Month-on-month |
|---|---|---|
| International City | 424,987 | -0.90% |
| Dubai Residence Complex | 650,504 | -1.25% |
| Discovery Gardens | 702,069 | -0.12% |
| Dubai Production City | 708,584 | -0.46% |
| Rukan (apartments) | 762,575 | +1.51% |
| Dubai Silicon Oasis (apartments) | 807,645 | +1.06% |
| Dubai South Residential District (apartments) | 812,334 | -0.17% |
| Liwan | 813,739 | +5.04% |
| Dubai Sports City (apartments) | 852,790 | +2.25% |
| Dubai Studio City | 865,413 | +0.08% |
| Arjan | 913,623 | -0.63% |
| Al Khail Heights | 952,694 | +2.87% |
| Remraam | 1,017,849 | -0.72% |
| Dubai South (apartments) | 1,103,998 | -0.08% |
| Wasl Gate (apartments) | 1,112,888 | +2.38% |
| Al Barsha (apartments) | 1,116,499 | -3.10% |
| Jumeirah Village Triangle (apartments) | 1,208,239 | -1.90% |
| Jumeirah Village Circle (apartments) | 1,257,616 | -1.35% |
| Dubai Investments Park (apartments) | 1,341,572 | -1.39% |
| Motor City (apartments) | 1,369,913 | -0.21% |
| Dubai Healthcare City 2 (apartments) | 1,419,828 | -0.99% |
| Rukan (villas) | 1,491,938 | -0.67% |
| Barsha Heights | 1,506,912 | +3.09% |
| Al Jaddaf (apartments) | 1,597,886 | +0.74% |
| Dubai Science Park (apartments) | 1,669,759 | -2.76% |
| DAMAC Hills (apartments) | 1,692,755 | -0.60% |
| Living Legends (apartments) | 1,766,673 | +1.51% |
| Jumeirah Lakes Towers | 1,781,860 | -0.87% |
| DAMAC Hills 2 (villas) | 1,788,858 | -1.13% |
| The Greens (apartments) | 1,931,728 | +0.20% |
| Sobha Hartland (apartments) | 1,937,174 | -1.82% |
| DAMAC Hills 2 (apartments) | 2,090,706 | -1.50% |
| Town Square (apartments) | 2,150,688 | -0.85% |
| Dubai Marina | 2,341,453 | -2.45% |
| Business Bay | 2,386,397 | -0.70% |
| The Views (apartments) | 2,562,147 | -0.72% |
| Dubai Maritime City | 2,579,905 | +1.49% |
| Jumeirah Golf Estates (apartments) | 2,601,918 | -0.77% |
| Al Habtoor City | 2,612,348 | -1.24% |
| Downtown Dubai | 2,641,459 | -1.82% |
| Jumeirah Beach Residence | 2,653,072 | -4.21% |
| Dubai Creek Harbour | 2,795,873 | -0.82% |
| Town Square Townhouses | 2,884,851 | +0.07% |
| Dubai South Townhouses | 3,084,328 | +0.34% |
| DIFC | 3,126,563 | -2.90% |
| Madinat Jumeirah Living (apartments) | 3,131,835 | -6.66% |
| Serena | 3,188,716 | +1.33% |
| Dubai Hills Estate (apartments) | 3,308,800 | -1.89% |
| Dubai Festival City | 3,332,945 | -4.33% |
| Villanova (villas) | 3,499,974 | -0.53% |
| Reem Townhouses | 3,558,007 | +0.58% |
| DAMAC Lagoons (villas) | 3,743,246 | -0.73% |
| The Hills | 3,989,683 | +1.92% |
| Jumeirah Village Circle (villas) | 4,170,763 | +4.28% |
| Dubai Harbour | 4,271,851 | -1.27% |
| Al Furjan (apartments) | 4,320,135 | -1.25% |
| Jumeirah Heights (apartments) | 4,433,744 | +6.60% |
| Dubai South Residential District (villas) | 4,557,374 | -0.13% |
| Nad Al Sheba (villas) | 4,686,764 | -1.08% |
| The Springs (villas) | 4,901,957 | +0.48% |
| Wasl Gate (villas) | 4,911,906 | -0.77% |
| The Sustainable City (villas) | 4,953,354 | +5.40% |
| City Walk | 5,102,520 | +0.28% |
| Dubai Water Canal (apartments) | 5,119,530 | +5.78% |
| Al Furjan (villas) | 5,368,896 | -1.58% |
| Dubai Silicon Oasis (villas) | 5,385,439 | -0.99% |
| Jumeirah Village Triangle (villas) | 5,417,076 | +5.76% |
| Palm Jumeirah (apartments) | 5,523,236 | -3.74% |
| Falcon City of Wonders | 5,717,340 | -0.02% |
| Arabian Ranches 3 | 5,721,218 | -1.20% |
| Mudon | 5,848,066 | -0.08% |
| Meydan (apartments) | 5,912,760 | +4.30% |
| Arabian Ranches 2 | 6,153,001 | -0.22% |
| Living Legends (villas) | 6,298,404 | +2.61% |
| Arabian Ranches | 6,314,814 | -0.43% |
| DAMAC Hills (villas) | 6,885,039 | +1.48% |
| Dubai Hills Estate (villas) | 6,951,323 | -3.24% |
| Dubai Science Park (villas) | 7,140,961 | -1.12% |
| The Valley | 7,778,258 | -0.40% |
| Motor City (villas) | 7,893,566 | -0.55% |
| Dubai Sports City (villas) | 8,496,073 | -0.85% |
| The Villa | 9,108,081 | +1.70% |
| Jumeirah Park | 9,292,380 | +1.52% |
| Bluewaters Island | 9,960,123 | -4.17% |
| Tilal Al Ghaf | 10,173,696 | +1.23% |
| Jumeirah Golf Estates (villas) | 11,691,632 | -2.28% |
| Meydan (villas) | 12,483,983 | -1.12% |
| The Meadows (villas) | 13,593,001 | -0.12% |
| Jumeirah Bay Island (apartments) | 24,264,756 | -2.34% |
| Jumeirah Bay Island (villas) | 30,482,255 | unchanged |
| Palm Jumeirah Fronds (Garden Homes) | 48,148,136 | +5.49% |
The gap between the cheapest and most expensive community in this list is more than 113 times: from AED 424,987 in International City to AED 48,148,136 for Palm Jumeirah Garden Homes. This is why a single citywide 'average Dubai property price' tells a buyer almost nothing without naming the community.
The most affordable Dubai communities
Of the 91 communities tracked, 12 have a median price below AED 1 million. The lowest is International City at a median of AED 424,987.
| Community | Median price (AED) |
|---|---|
| International City | 424,987 |
| Dubai Residence Complex | 650,504 |
| Discovery Gardens | 702,069 |
| Dubai Production City | 708,584 |
| Rukan (apartments) | 762,575 |
| Dubai Silicon Oasis (apartments) | 807,645 |
| Dubai South Residential District (apartments) | 812,334 |
| Liwan | 813,739 |
| Dubai Sports City (apartments) | 852,790 |
| Dubai Studio City | 865,413 |
| Arjan | 913,623 |
| Al Khail Heights | 952,694 |
Across the whole market the distribution is: 12 communities below AED 1 million, 19 between AED 1 million and 2 million, 31 between AED 2 million and 5 million, and 29 above AED 5 million. Roughly a third of Dubai communities have a median under AED 2 million.
These are community medians, not floor prices. Studios and one-bedroom units trade below the median in most of these areas, particularly in off-plan projects where payment is staged across construction.
Which Dubai communities rose and which fell?
This month's pattern runs against the common assumption that waterfront property only moves in one direction. Prime and beachfront communities recorded the steepest declines; mid-market and villa communities led the gains.
Largest monthly declines
| Community | Median price (AED) | Month-on-month |
|---|---|---|
| Madinat Jumeirah Living (apartments) | 3,131,835 | -6.66% |
| Dubai Festival City | 3,332,945 | -4.33% |
| Jumeirah Beach Residence | 2,653,072 | -4.21% |
| Bluewaters Island | 9,960,123 | -4.17% |
| Palm Jumeirah (apartments) | 5,523,236 | -3.74% |
| Dubai Hills Estate (villas) | 6,951,323 | -3.24% |
| Al Barsha (apartments) | 1,116,499 | -3.10% |
| DIFC | 3,126,563 | -2.90% |
Largest monthly gains
| Community | Median price (AED) | Month-on-month |
|---|---|---|
| Jumeirah Heights (apartments) | 4,433,744 | +6.60% |
| Dubai Water Canal (apartments) | 5,119,530 | +5.78% |
| Jumeirah Village Triangle (villas) | 5,417,076 | +5.76% |
| Palm Jumeirah Fronds (Garden Homes) | 48,148,136 | +5.49% |
| The Sustainable City (villas) | 4,953,354 | +5.40% |
| Liwan | 813,739 | +5.04% |
| Meydan (apartments) | 5,912,760 | +4.30% |
| Jumeirah Village Circle (villas) | 4,170,763 | +4.28% |
Madinat Jumeirah Living led the declines at 6.66 percent and Jumeirah Heights led the gains at 6.60 percent. Palm Jumeirah apartments fell 3.74 percent and Bluewaters Island 4.17 percent, while The Sustainable City rose 5.40 percent and Jumeirah Village Triangle villas rose 5.76 percent.
These are single-month movements. In a market registering 5,138 deals in half a month, one month indicates direction, not destiny.
What the Dubai rental market shows
28,547 residential rental contracts were registered in Dubai in July 2026, worth AED 2.59 billion in total. The average annual rent across the market is AED 90,666, or AED 83 per square foot.
For an investor this is the half of the market that determines the return.
Rent by property type
| Property type | Contracts | Average annual rent (AED) | Average size (sq ft) | Rent (AED/sq ft) |
|---|---|---|---|---|
| Apartment | 25,054 | 72,949 | 1,064 | 83 |
| Villa | 1,822 | 262,000 | 3,601 | 81 |
| Townhouse | 1,671 | 169,492 | 2,284 | 75 |
Rent by bedroom count
| Bedrooms | Average annual rent (AED) | Rent (AED/sq ft) |
|---|---|---|
| Studio | 39,969 | 99 |
| 1 bedroom | 61,814 | 83 |
| 2 bedroom | 88,442 | 75 |
| 3 bedroom | 152,394 | 76 |
| 4 bedroom | 263,291 | 82 |
| 5 bedroom | 421,499 | 95 |
| 6 bedroom | 993,996 | 138 |
A detail hides in the per-square-foot column. A studio rents at AED 99 per square foot, the most expensive space in Dubai, while a two-bedroom rents at AED 75. Every square foot of a studio therefore earns about 32 percent more than the same square foot in a two-bedroom. For an investor optimising return per dirham invested, that number goes straight to the bottom line.
What Dubai tenants actually pay
The distribution of rents shows that Dubai's rental market is, despite its image, predominantly a mid-market one. 64.1 percent of contracts are signed below AED 80,000 a year.
| Annual rent band | Share of contracts |
|---|---|
| Under AED 50,000 | 28.4% |
| AED 50,000 to 80,000 | 35.7% |
| AED 80,000 to 120,000 | 17.4% |
| AED 120,000 to 160,000 | 7.8% |
| AED 160,000 to 200,000 | 4.3% |
| Above AED 200,000 | 6.5% |
Only 6.5 percent of contracts exceed AED 200,000 a year. Real rental demand is concentrated in the AED 50,000 to 80,000 band, which is exactly where one-bedroom units in mid-market communities sit (average one-bedroom rent: AED 61,814).
The message for an investor is direct: buy a property that rents in the band where the tenants are. A one or two-bedroom unit in a mid-market community has a queue of tenants, while a luxury unit competes for the 6.5 percent at the top of the market.
Is now a good time to buy property in Dubai?
The data describes a market finding balance. When 59 of 91 communities post small monthly declines while 31 still rise, negotiating power shifts toward the buyer without asset values collapsing. Most declines are under 2 percent.
Three conclusions follow directly from the numbers.
One. Prime waterfront currently offers the most negotiating room, because it has given up the most ground. Palm Jumeirah, Bluewaters and JBR all fell between 3.7 and 4.2 percent.
Two. Mid-market and villa communities are still rising, supported by genuine end-user demand. This is the same segment that absorbs 64.1 percent of rental contracts, which means it does not sit empty.
Three. With off-plan at 69.9 percent of transactions, developers continue to offer extended payment plans, keeping the entry point open for buyers with limited upfront capital.
The right answer depends on the objective. For rental income from day one, a completed mid-market unit is the more logical route. For entry with less capital and staged payments, off-plan remains the primary option.
Where this data comes from (methodology and limitations)
Every figure in this report comes from Dubai Land Department (DLD) transaction registry data, accessed through the Property Monitor platform. Data extracted 15 July 2026.
Five notes for reading it correctly:
- Transaction counts are month-to-date. The 5,138 transactions are those registered up to the extraction date; the total will rise before month end. It should not be compared against full months.
- Median, not average. The median is the midpoint of recorded sales and, unlike an average, is not distorted by a handful of very expensive deals.
- Oqood versus title deed. Oqood registers off-plan sales; title deeds record transfers of completed property. Separating the two produces the 69.9 percent off-plan figure.
- Rental data is separate from sales data. Rent figures come from contracts registered in the same month and are citywide averages, not per-community averages. Rental yield varies by community and must be calculated individually.
- Communities tracked. Figures cover the 91 Dubai communities with enough transaction volume to produce a reliable median.
Alsama Group is registered under licence number 45931 in the Dubai Land Department register of licensed real estate brokers. This report is updated monthly; the current edition reflects data to 15 July 2026.